Two Hard Problems from My HNG Internship: Building a WAL from Scratch, Then Making Prometheus Work
Two Hard Problems from My HNG Internship: Building a WAL from Scratch, Then Making Prometheus Work
During HNG14 I worked on two tracks simultaneously. The solo track was a series of backend stages — each one building on top of the last, starting with a basic classification API and ending with infrastructure-level work. The team track was SkillBridge, a real product: a talent assessment platform that employers use to find verified candidates.
This post is about one task from each track. Not the biggest ones, not the most feature-rich. The ones where I was stuck long enough that I genuinely learned something, where the problem wasn't in the spec and the fix wasn't obvious.
Part 1 — Stage 7a: Building an Append-Only Event Store
Why I picked this one
Every stage before this had Postgres underneath it. I could write bad queries, forget an index, make a schema mistake — Postgres would absorb the damage. Stage 7a removed that entirely. The constraint was explicit: build an HTTP service that persists events to a flat file. No SQLite. No database at all. The file is the database.
That constraint forced me to think about things I had been ignoring since I started writing backend code: what "persisted" actually means, what happens when a write is interrupted, and why production databases are built the way they are. I picked it because it changed how I read infrastructure documentation. Postgres WAL docs make sense to me now. Kafka's log storage makes sense. That's worth writing about.
What it was
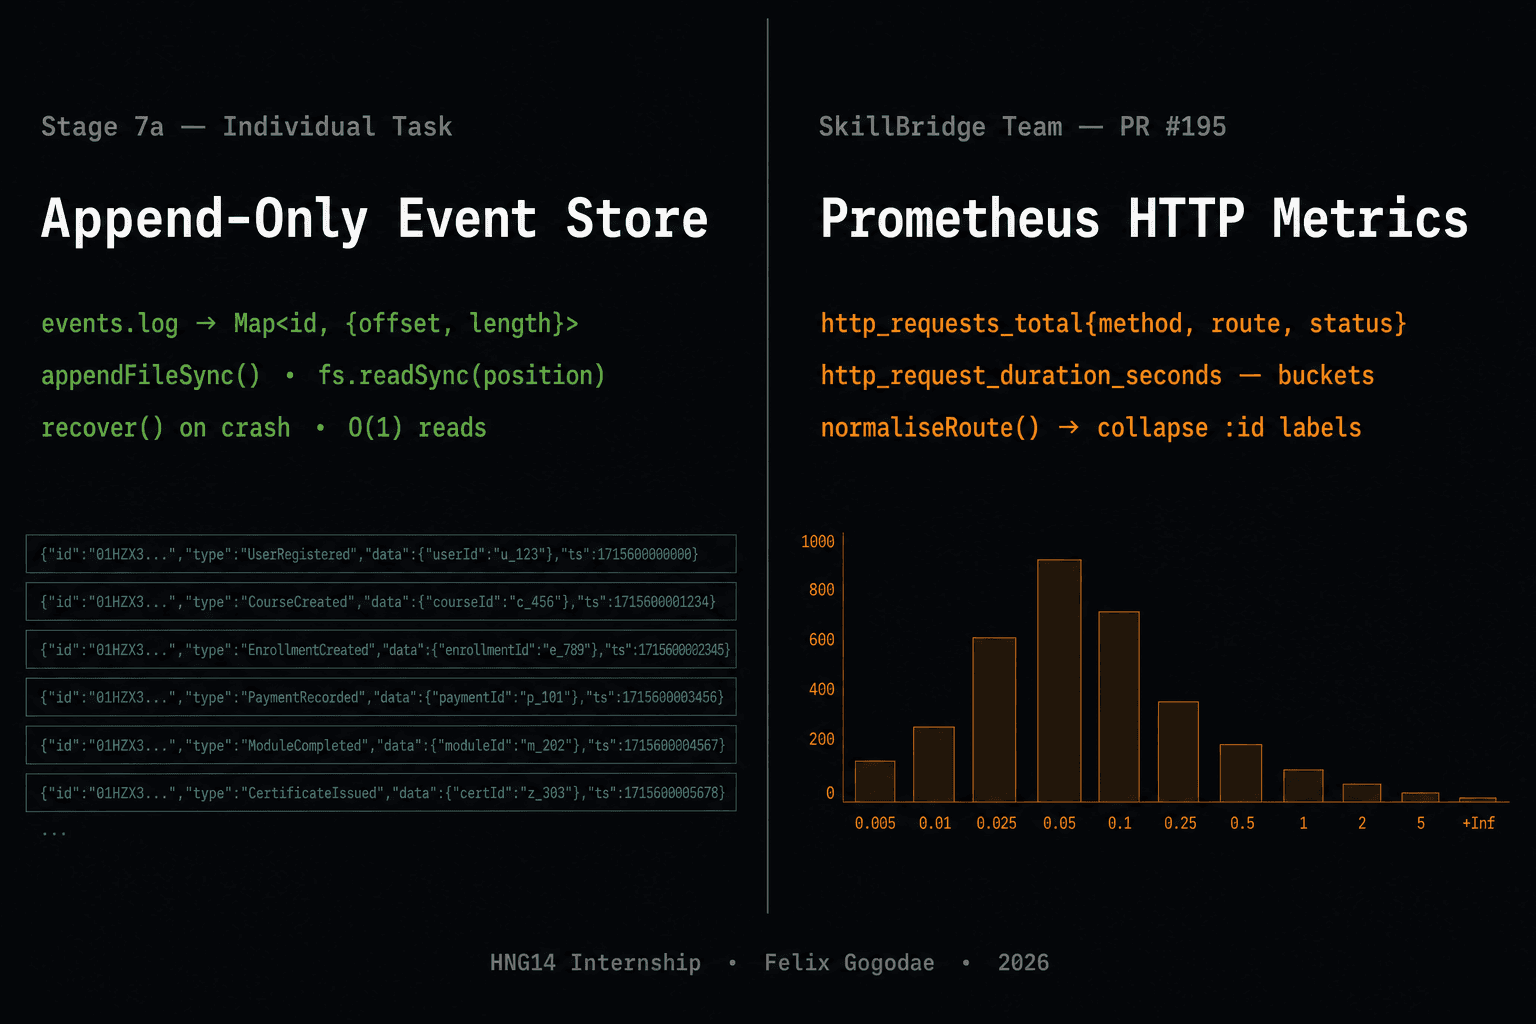
The task was to prototype the persistence layer for a hypothetical 2M-MAU social platform. The service had three endpoints:
POST /events— accept any JSON object, stamp an ID and timestamp, persist itGET /events/:id— retrieve a single event by IDGET /stats— total events written and bytes on disk
The constraints:
- Events are never modified or deleted — append only
- Reads must stay fast as the log grows — O(1), not O(n)
- The service must survive a crash without losing previously written events
The problem it was solving
When you overwrite a file in place, two things happen: erase the old bytes, write the new ones. If the process dies between those two operations, you get a file that is neither the old data nor the new data — a torn write. The only way to avoid this is to never touch existing bytes. Append only.
That handles writes. Reads are the other problem. If the only way to find an event is to scan the file from byte 0 and compare IDs line by line, read latency grows with the file. At 10 million events that scan is unusable. The solution is to keep an in-memory index: a Map<id, { offset, length }> that tells you exactly where each event lives in the file, so a read becomes a direct byte-range seek rather than a scan.
How I approached it
The architecture is three pieces working together:
Architecture overview
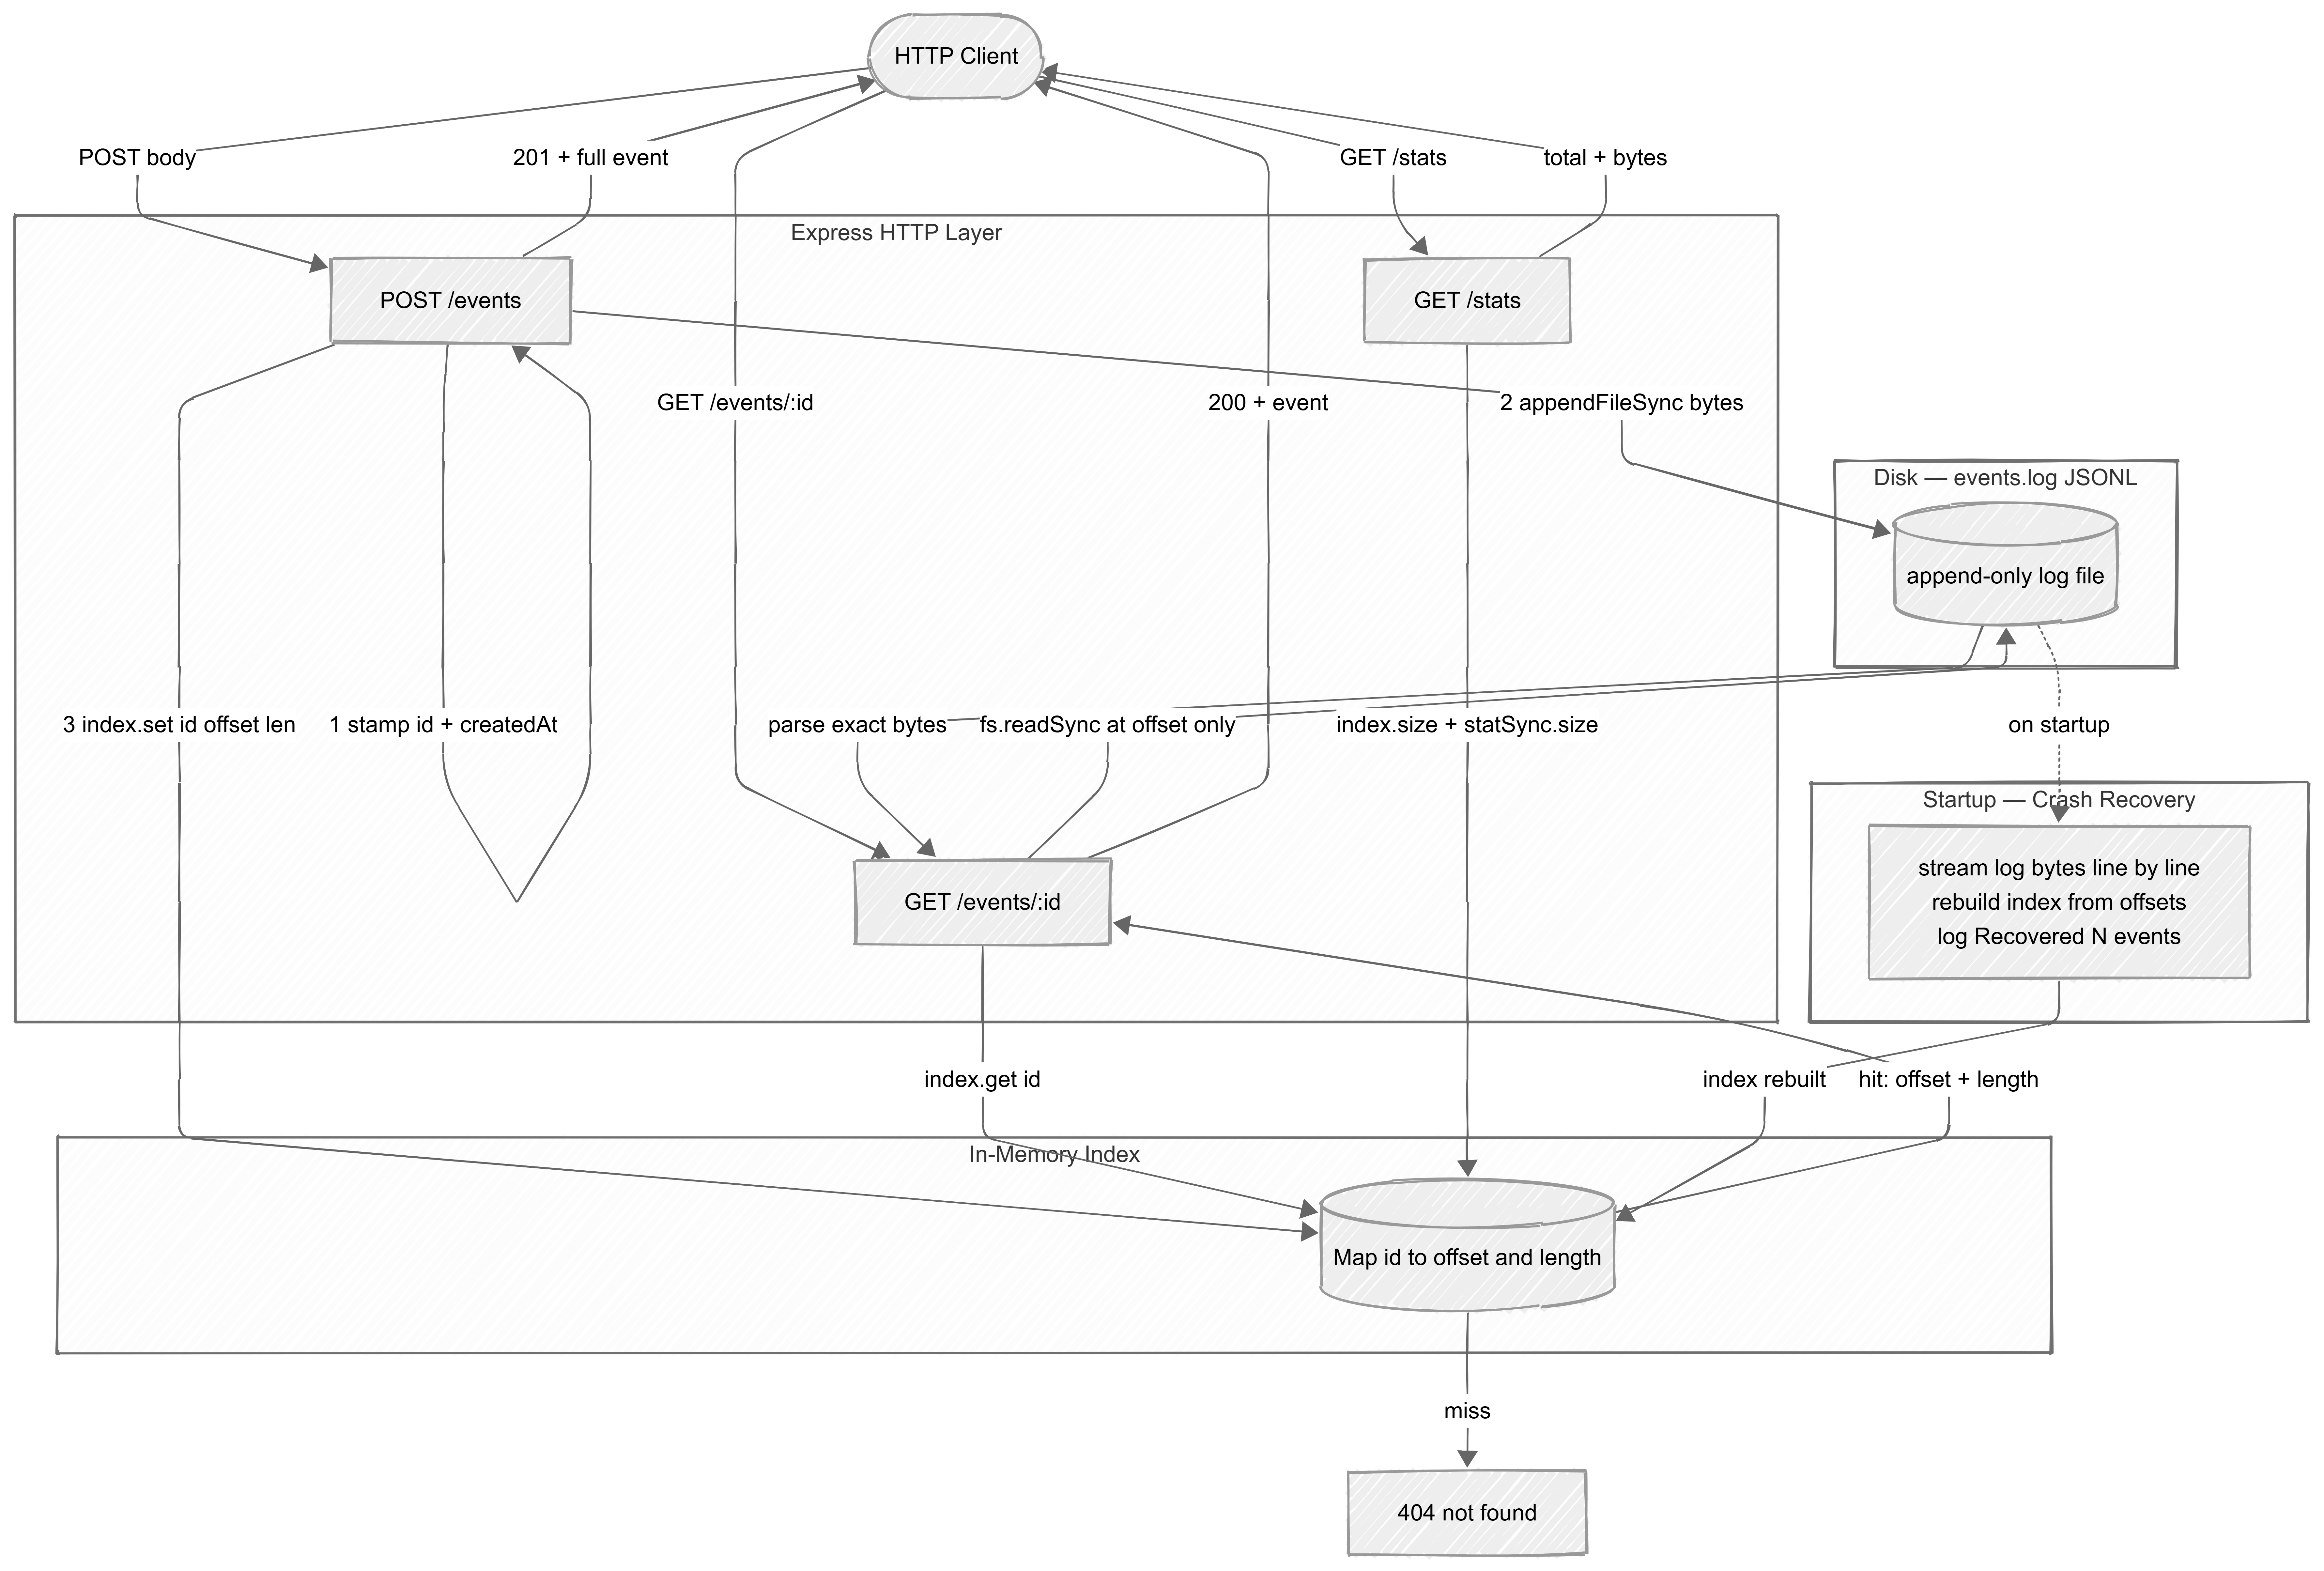
Write path:
  POST /events
    → stamp id + createdAt
    → capture current file size (= byte offset of the new event)
    → appendFileSync to events.log
    → store { offset, length } in the Map

Read path:
  GET /events/:id
    → Map.get(id)           → O(1) hash lookup
    → fs.readSync at offset → O(1) byte-range seek
    → JSON.parse and return

Recovery (on startup):
  → scan raw file bytes for 0x0a (newline)
  → for each line: JSON.parse, index the event with its offset and length
  → skip malformed lines (partial writes from prior crashes)
The write method in store.ts:
append(payload: Record<string, unknown>): StoredEvent {
  const event: StoredEvent = {
    ...payload,
    id: randomUUID(),
    createdAt: new Date().toISOString(),
  };

  const line = JSON.stringify(event) + "\n";
  const bytes = Buffer.from(line, "utf8");

  // Capture offset before writing so it matches the byte position on disk.
  let offset = 0;
  try {
    offset = fs.statSync(this.logPath).size;
  } catch {
    offset = 0; // file doesn't exist yet; first write starts at byte 0
  }

  fs.appendFileSync(this.logPath, bytes);
  this.index.set(event.id, { offset, length: bytes.length });

  return event;
}
Two things matter in that function. First, Buffer.from(line, "utf8") — more on why in a moment. Second, the offset is captured before the append, not after. If you capture it after, write-time offsets and recovery-time offsets will disagree, and reads will silently return wrong data.
What broke and how I fixed it
Bug 1: readline in recovery broke offset math
My first recovery implementation used Node's readline module — the obvious choice for reading a file line by line. It worked. Tests passed. Then I restarted the server after writing a few events and every GET /events/:id came back 404.
The problem: readline strips the \n from each line before giving it to you. That means the "length" I computed during recovery was bytes of JSON only, while the length stored at write time was bytes of JSON + 1 byte for the newline. Every offset was off by one, and the error accumulated — by the tenth event the seek was off by ten bytes and reading garbage.
The fix was to stop using readline entirely and iterate the raw buffer:
recover(): number {
  this.index.clear();

  if (!fs.existsSync(this.logPath)) {
    console.log("Recovered 0 events");
    return 0;
  }

  const raw = fs.readFileSync(this.logPath);
  let offset = 0;
  let lineStart = 0;

  for (let i = 0; i <= raw.length; i++) {
    if (i === raw.length || raw[i] === 0x0a) { // 0x0a == '\n'
      if (i > lineStart) {
        const lineBytes = raw.slice(lineStart, i + 1); // include the \n
        const lineStr = raw.slice(lineStart, i).toString("utf8");
        try {
          const event = JSON.parse(lineStr) as StoredEvent;
          if (typeof event.id === "string") {
            this.index.set(event.id, { offset, length: lineBytes.length });
          }
        } catch {
          // Skip malformed lines — partial write from a prior crash
        }
        offset += lineBytes.length;
      } else {
        if (i < raw.length) offset += 1;
      }
      lineStart = i + 1;
    }
  }

  console.log(`Recovered ${this.index.size} events`);
  return this.index.size;
}
lineBytes includes the newline. lineStr does not — lineStr is what gets parsed, lineBytes.length is what gets stored as the length. Write-time and recovery-time now agree exactly.
Bug 2: str.length instead of byte length
Once recovery was fixed I ran a test with a payload containing "café 🎉". The event wrote fine. Recovery ran. The GET returned a JSON parse error.
"café 🎉" is 10 characters but 14 bytes in UTF-8. I had used str.length somewhere in an earlier draft to compute offsets, which counts characters. Once the index was off by 4 bytes, fs.readSync would read the wrong slice of the file and return unparseable bytes.
The rule is simple: whenever you measure something that will be used as a file offset, use Buffer.from(str, "utf8").length. Never str.length. The fix was already implicit once I switched to buffer slicing in recovery — lineBytes.length is byte length by definition — but it reinforced the habit.
Bug 3: ESM import paths
Unrelated to the core logic but it cost me 30 minutes: with "type": "module" in package.json, Node requires .js extensions on all relative imports even when the source is TypeScript. import { EventStore } from "./store" fails at runtime. It has to be "./store.js". The tsx dev runner handles this transparently, so it only breaks when you run the compiled output directly.
What I took away
Crash-safety reflex. Before this, "persisting data" meant calling an ORM method and trusting the framework. Now my first question on any write operation is: what happens if the process dies halfway through? If the answer is "corrupt state", I need to rethink the design.
WAL mental model. This project is a miniature write-ahead log. Every production database — Postgres, SQLite, RocksDB — uses this pattern. Understanding it from first principles made the Postgres crash recovery documentation much less abstract. Kafka's log-based storage is the same idea at scale.
Index before you need it. A file scan on 100 events is instant. On 10 million events it's unusable. Building the in-memory index from the start, not as a later optimisation, is the right default.
Unicode safety is a reflex, not a special case. Every time I measure length for anything that touches bytes, I use the byte length. That's just correct now.
Part 2 — Prometheus on SkillBridge: The Cardinality Problem
Why I picked this one
Of all the work I did on SkillBridge — assessment engines, employer discovery APIs, AI report generation — I keep coming back to this one. Not because it was the most complex. It was 128 lines. I picked it because the mistake it prevents is one of those things that works perfectly in development and silently degrades production, and nobody tells you about it unless you've seen it before.
What it was
SkillBridge is a NestJS API. Before this PR it had no request-level observability — no way to answer "which routes are slow?", "how many 500s did we get in the last hour?", or "what's the p95 latency on the assessment submission endpoint?".
PR #195 added a Prometheus metrics module. Three files:
MetricsModule— callscollectDefaultMetrics({ prefix: 'skillbridge_' })on boot. This gives you Node process metrics for free: heap usage, event loop lag, active handles.MetricsController— a publicGET /metricsendpoint that the Prometheus scraper polls.MetricsInterceptor— a globalAPP_INTERCEPTORthat wraps every incoming request, starts a timer, and records duration and status when the handler resolves.
Two custom metrics:
http_requests_total          — Counter, labels: method, route, status
http_request_duration_seconds — Histogram, labels: method, route, status
                                buckets: [0.05, 0.1, 0.2, 0.5, 1, 2, 5]
The problem it was solving
SkillBridge was approaching its first production launch. The assessment flow has high variance: a personal assessment is fast (database reads), a skill assessment involves question banks, an advanced assessment triggers AI calls that can take 2–5 seconds. You cannot debug that variance blind.
The team needed to answer three questions from production traffic:
- Which routes are slow?
- What's our error rate by endpoint?
- Is an AI provider outage showing up as latency spikes?
Without request-level metrics, none of those questions are answerable in real time. You find out from a user complaint or a support ticket.
How I approached it
A NestJS global interceptor is the right hook for this. You register it once in app.module.ts as APP_INTERCEPTOR and it wraps every route handler automatically — no changes to individual controllers.
// app.module.ts
{
  provide: APP_INTERCEPTOR,
  useClass: MetricsInterceptor,
}
The interceptor uses RxJS operators to instrument both the success and the error path:
@Injectable()
export class MetricsInterceptor implements NestInterceptor {
  intercept(context: ExecutionContext, next: CallHandler): Observable<unknown> {
    const req = context.switchToHttp().getRequest<Request>();
    const method = req.method;
    const route = normaliseRoute(req.url);
    const end = httpRequestDuration.startTimer({ method, route });

    return next.handle().pipe(
      tap(() => {
        const status = String(res.statusCode);
        end({ status });
        httpRequestsTotal.inc({ method, route, status });
      }),
      catchError((err: unknown) => {
        const status =
          err instanceof HttpException ? String(err.getStatus()) : '500';
        end({ status });
        httpRequestsTotal.inc({ method, route, status });
        return throwError(() => err);
      }),
    );
  }
}
tap fires on success. catchError fires on any thrown exception — and critically, it preserves the actual HTTP status from the HttpException rather than recording everything as 500.
What broke — the cardinality problem
The first version of the interceptor used req.url directly as the route label. That seemed fine until I thought about what Prometheus actually does with labels.
Every unique combination of label values creates a separate time series in Prometheus. With route = req.url, the assessment endpoints alone would generate entries like:
http_requests_total{route="/talent/assessment/a1b2c3d4-1111-2222-3333-444455556666"}
http_requests_total{route="/talent/assessment/b9f0e1d2-5555-6666-7777-888899990000"}
http_requests_total{route="/talent/assessment/c3d4e5f6-aaaa-bbbb-cccc-ddddeeee1111"}
One time series per user, per request. With any real traffic that's tens of thousands of series for a single endpoint. Prometheus slows down. Queries time out. The metrics store grows until it becomes a problem in its own right.
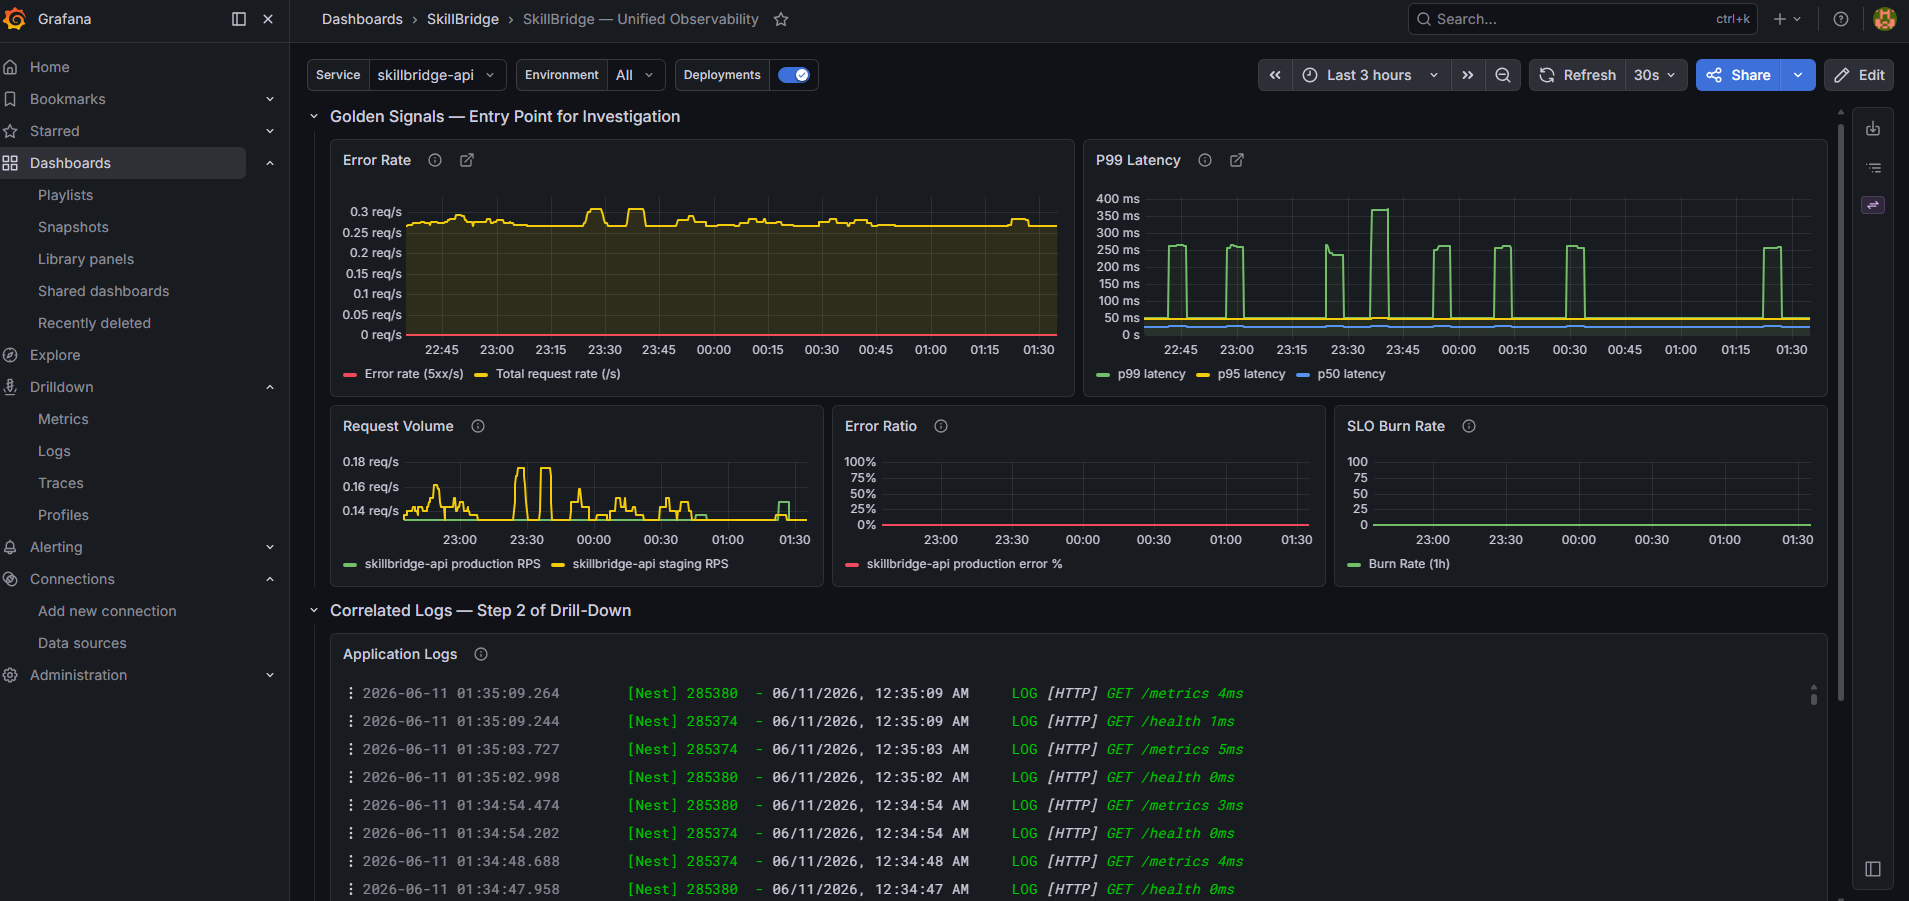
I was also on DevOps for SkillBridge, so the work didn't stop at the API. I set up Grafana, pointed it at the Prometheus endpoint, and built out the panel, request rate, error rate, p95 latency by route, etc. The screenshot below is the actual dashboard.
The fix is route normalization — collapse IDs before they become label values:
function normaliseRoute(url: string): string {
  return url
    .split('?')[0]
    .replace(
      /[0-9a-f]{8}-[0-9a-f]{4}-[0-9a-f]{4}-[0-9a-f]{4}-[0-9a-f]{12}/gi,
      ':id',
    )
    .replace(/\/\d+/g, '/:id');
}
Three things happen here:
- Query strings are stripped —
?page=2&sort=ascwould otherwise create a separate series per query combination - UUIDs are replaced with
:id - Numeric path segments are replaced with
:id
After normalization, all requests to GET /talent/assessment/{any-uuid} produce the same label: route="/talent/assessment/:id". One time series per endpoint shape, not one per request.
The auth problem
The GET /metrics endpoint is public — Prometheus needs to scrape it unauthenticated. But the global JWT guard in SkillBridge blocks every route by default. Without explicitly opting out, the scraper would get a 401 on every poll and the metrics page would stay empty.
The fix is a @Public() decorator on MetricsController:
@Controller('metrics')
export class MetricsController {
  @Public()
  @Get()
  async metrics(@Res() res: Response) {
    res.set('Content-Type', register.contentType);
    res.end(await register.metrics());
  }
}
Small thing. Easy to miss. The kind of thing you only notice after deploying and wondering why Grafana has no data.
What I took away
Observability is a feature, not a post-launch task. The assessment AI calls could silently start timing out a week after launch. Without duration histograms, the first signal would be a user complaint. Ship metrics before you ship the product.
Prometheus labels are a schema decision. Unbounded label values don't just make dashboards messy — they can take down the metrics store under load. Every label value should have a known, finite cardinality. Route normalization is table stakes.
Global interceptors are the right abstraction. The alternative — adding instrumentation to every controller method — would have meant touching dozens of files and would inevitably drift as new routes were added. One interceptor, registered once, covers everything.
Histogram bucket choice reflects your actual SLOs. The default bucket set assumes sub-500ms responses. SkillBridge has AI calls that legitimately take 2–5 seconds. Buckets that stop at 500ms make those look like they all fall into the same ">= 500ms" bin. I extended the buckets to
[0.05, 0.1, 0.2, 0.5, 1, 2, 5]so the histogram actually shows the distribution shape for slow endpoints.
What connects them
These two tasks look different on the surface. One is a solo infrastructure prototype in Node. The other is a 128-line addition to a production NestJS API. But both of them were caught by the same kind of problem: the spec describes the happy path and stops there.
"Build an event store" doesn't mention bytes versus characters. "Add Prometheus metrics" doesn't mention label cardinality. The interesting part — the part that takes longer than it should — is always in the edge case the task description doesn't cover.
That's true of almost everything in production backend work. The feature is usually not the hard part. The hard part is what happens when the process crashes mid-write, or when real traffic creates ten thousand label combinations you didn't anticipate, or when an emoji payload silently corrupts a byte offset.
Both of these tasks taught me to ask that question earlier: not "does this work?" but "what happens when this doesn't work the way I assumed it would?"
The event store is open source: github.com/Trojanhorse7/eventstore — includes a demo video. SkillBridge is the HNG14 team product I contributed to during the internship.